


If your AI dashboard still celebrates lines of code, you are measuring theater.
Not maturity.
Your board will, sooner than you think, ask you how to evaluate AI engineering effectiveness. The CFO will want to know whether the AI investment is producing return. The audit committee will want to know whether the output meets the quality bar the company commits to. The CEO will want a coherent answer for the next strategy review. Most engineering leaders, asked that question today, reach for the metrics they already had — commits per developer, velocity per sprint, lines of code shipped, time saved per task — and present those numbers as if they answered the question.
They do not answer the question. They measure activity. The board is asking about effectiveness, which is a different category. The gap between the two is where most AI initiatives quietly degrade, because the team is rewarded for activity that produces output, and nobody is measuring whether the output holds up.
The leaders who can actually answer their board's question are measuring something else. They are measuring the properties of the system that produces the output, not the volume of output produced. The shift sounds subtle. It is not.
Why old metrics fail
The legacy software metrics — commits, velocity, lines of code, story points, deployment frequency — were never great proxies for engineering effectiveness, but they were defensible in a world where the human producing the output was also the constraining factor on quality. A senior engineer producing many commits was usually producing reasonably good commits, because their judgment was the bottleneck and their judgment was the same throughout the day. Activity correlated with effectiveness, because the human doing the activity was the source of the effectiveness.
That correlation breaks the moment AI enters the pipeline. An AI agent can produce a hundred commits in an afternoon. The volume tells you nothing about whether any of those commits held up against the specification, passed validation, or required rework before they could ship. A team that adopts AI and reports a 5x increase in commit volume has not reported a 5x increase in effectiveness. They have reported a 5x increase in raw output. The output may be terrible. The output may be excellent. The metric does not distinguish.
Lines of code is the worst of the legacy metrics in this context, because AI generates lines of code as a side effect of doing almost any task. Counting them tells you that the AI is operating, which you already knew. It does not tell you whether the lines of code work, whether they match what was specified, whether they will need to be rewritten next sprint, or whether they introduced regressions in modules the team was not paying attention to.
Velocity is barely better. Story points consumed per sprint, when AI is producing the implementation, captures whatever rate the team has chosen to push tickets through the system. The constraint is no longer human throughput. It is the team's discipline at validating the AI's output, which the velocity metric does not measure.
Time saved per task is the metric most teams reach for first, because it sounds like it is measuring AI value directly. It is measuring two things: how long the task used to take, and how long it takes now. It is not measuring the new failure modes the AI introduced — output that looked correct and shipped, then required a hot fix; output that needed rework before merge; output that quietly degraded a downstream module. The "time saved" arithmetic ignores the rework cost, the validation cost, and the production-incident cost, all of which are first-order in an AI-driven pipeline.
The legacy metrics are not wrong. They are insufficient. They were designed for a system where the constraint was human throughput. The system the team is now running has a different constraint, and the metrics need to follow.
Five metrics that actually matter
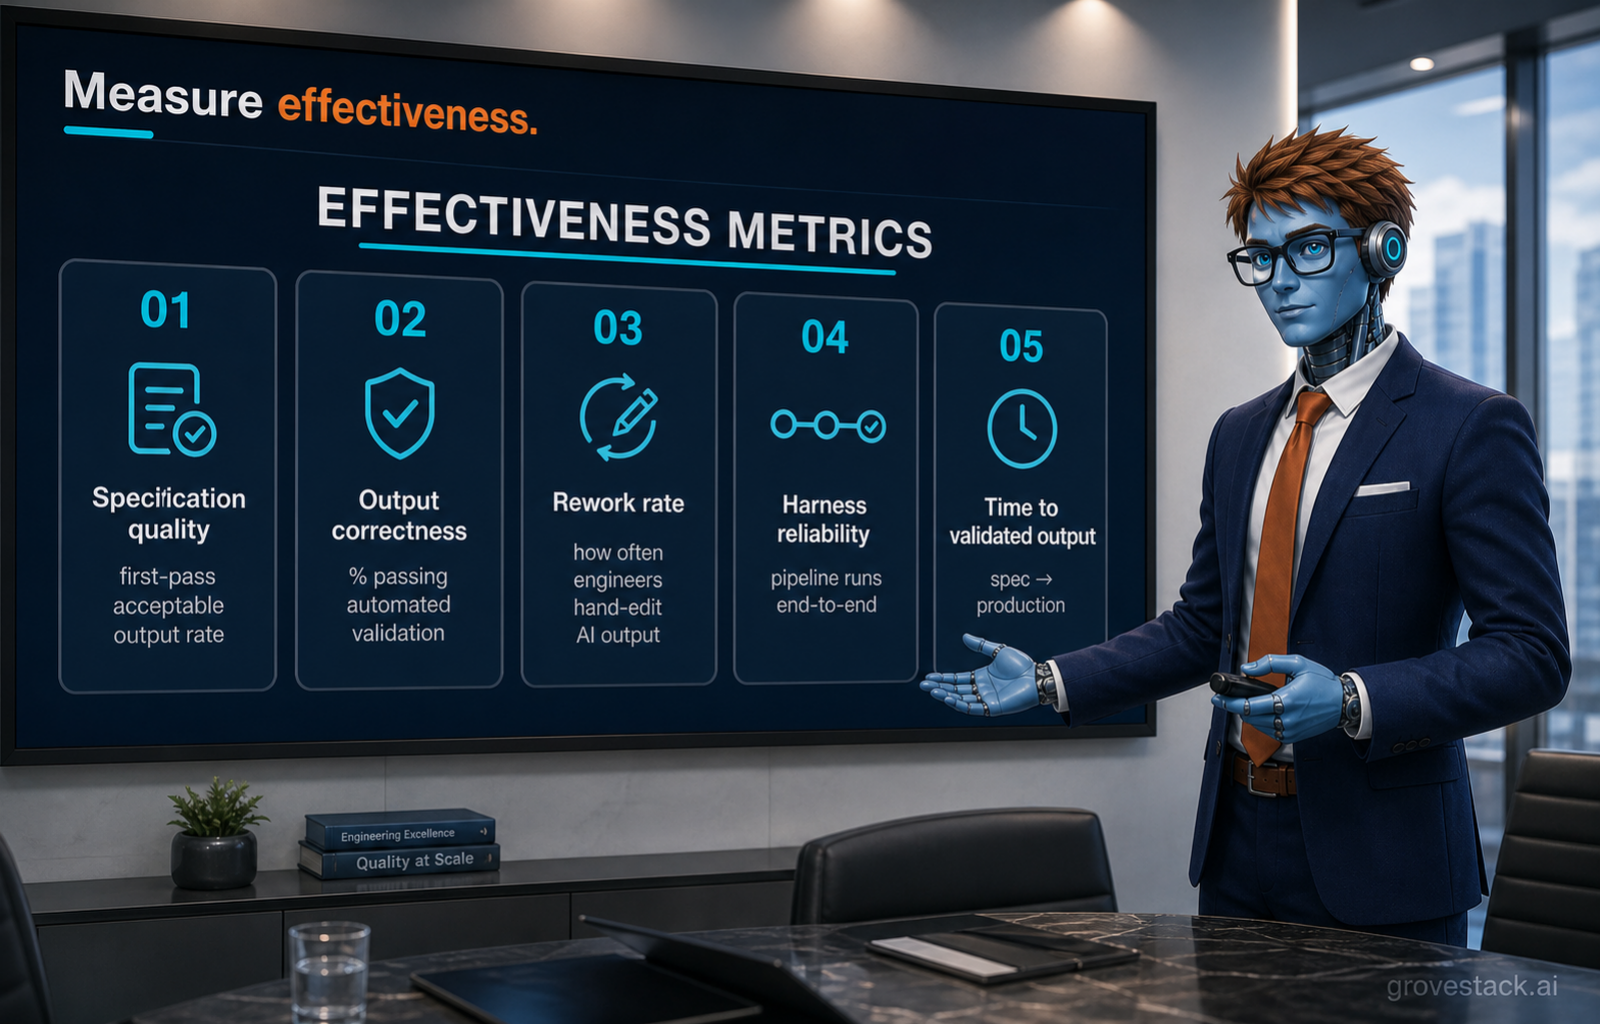
The metrics that distinguish AI engineering effectiveness from AI engineering theater fall into five categories. They share a common property: they measure properties of the system that produces output, not the volume of output produced.
Specification quality measures how often the first AI pass produces acceptable output. Acceptable, here, means it passes the validation gates without human rework. A team with high specification quality has invested in writing specs that are clear, complete, and machine-readable. The AI receives unambiguous direction and produces work that conforms. A team with low specification quality is shipping AI output that depends heavily on the engineer's edits to become acceptable, which means the spec was not actually directing the work — the engineer was. High first-pass rate is the leading indicator that the team's specifications are doing their job.
Output correctness measures the percentage of generated output that passes automated validation. Validation, here, is the gate the harness runs against AI output before it ships: tests, type checks, security scans, performance benchmarks, schema validation. Output that passes all of them at the threshold the team committed to is correct, by the team's own definition. Output that fails any of them is incorrect, regardless of whether a human reviewer waved it through. The metric is binary per artifact and aggregates to a percentage. A team running at 95% correctness is producing output the validation layer trusts. A team running at 60% is producing output that depends on human judgment to filter, which is the bottleneck the AI was supposed to remove.
Rework rate measures how often engineers hand-edit AI output before it can ship. Rework is the hidden cost of AI deployment. It does not show up in the velocity metric, because the ticket still gets closed in the sprint. It shows up as engineer time spent fixing what the AI produced, which is engineer time the AI was supposed to free up. Low rework rate means the specifications and context are doing their job — the AI is producing output the engineer can accept as-is. High rework rate means the engineer is the actual author of the final output, and the AI is producing first drafts that the engineer rewrites. The latter case can be worth it, but the team has to know it is what they are doing. Most teams discover this only when the rework metric forces the question.
Harness reliability measures whether the pipeline executes end-to-end successfully. The harness — the orchestration, validation, retrieval, and routing layer that runs AI work in production — is itself a piece of infrastructure that can fail. If the test agent times out, the security scan errors, or the orchestrator drops a task, the AI work either does not complete or completes without the checks that were supposed to gate it. Reliability is the rate at which the harness operates as designed. A team with 99% harness reliability has infrastructure they can count on. A team with 70% has infrastructure that fails one in three operations, and every failure is either a missed check or a manual intervention to recover, both of which erode the leverage AI was supposed to produce.
Time to validated output measures the duration from specification to production-ready result. Not from specification to "AI is done." Not from specification to "engineer accepted the output." From specification to a result that has passed every validation gate the team requires before something can ship. This is the real cycle time of AI engineering, and it is the metric that compares cleanly to the manual cycle time it replaces. A team that took two weeks manually and now takes five days to validated output has produced a real productivity gain. A team that produces "AI output" in five hours but takes two weeks to get it through validation has not actually accelerated anything.
These five metrics share a property the legacy metrics lack: they describe whether the engineering system is functioning, not whether engineers are typing. They are observable from the harness directly — the harness records every spec, every output, every validation result, every rework cycle, every pipeline execution. The data is in the system. It just has to be collected and exposed.
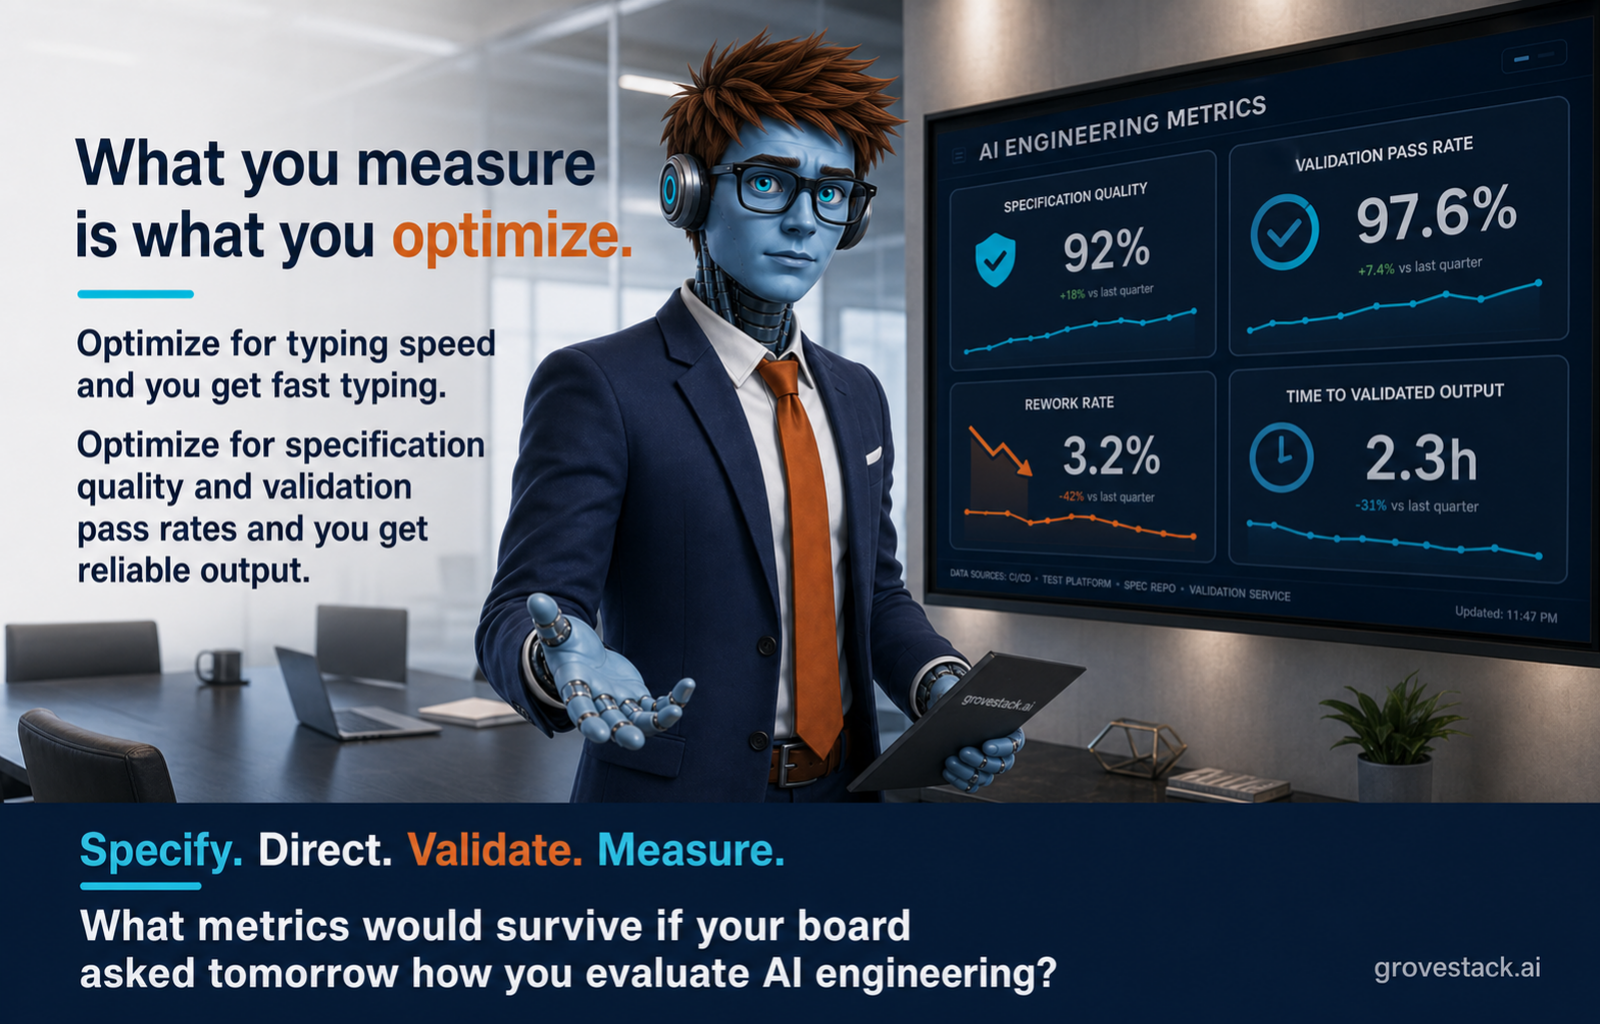
What you measure is what you optimize
The reason the metric question is strategic, rather than operational, is the implicit selection pressure metrics apply to behavior. Teams produce more of what is measured and rewarded. If the dashboard shows commits per developer, the team produces more commits. If it shows story points consumed, the team consumes more story points. If it shows AI output volume, the team produces more AI output, regardless of quality.
This is true of legacy software engineering and it is more true of AI-driven engineering, because the rate at which AI can produce volume is decoupled from the rate at which a human can produce thought. A team optimizing AI output volume can hit numbers that look spectacular while shipping a codebase that is silently degrading. The defect rate rises slowly. The rework cost compounds. The on-call burden grows. The velocity dashboard stays green until something visible breaks, and then the postmortem reveals that the team has been producing output the validation layer has not been trusted to gate, because trusting it would have slowed the apparent velocity.
Optimizing for specification quality and validation pass rates produces a different team. The team writes better specifications, because better specifications raise the first-pass rate. The team strengthens the validation layer, because gaps in validation raise the correctness number artificially. The team tightens the harness, because reliability is the floor under everything else. The team's behavior aligns with the metrics, and the metrics align with the properties of effective AI engineering.
The inverse is also true and more dangerous. Optimizing for activity metrics in an AI-driven pipeline produces teams that game the activity, because the activity is now cheap. Producing high commit volume requires the AI agent to be running. Producing high lines-of-code requires the AI to be generating. Neither requires the output to be correct, well-specified, or aligned with the team's actual goals. The team can hit the activity numbers while the underlying engineering quality erodes, and the dashboard will not surface the erosion until something downstream breaks visibly.
What you measure is what you optimize. The choice of metrics is the choice of what kind of AI engineering organization you are building.
The leadership consequence
The metric layer is leadership work. Engineers do not, on their own initiative, define the metrics by which their work is judged. Leaders do. The metrics flow from the strategic answer to the question "what does effective AI engineering mean for us?" — and that question is the architect-CEO's to answer.
In a one-person software company, the founder defines the metrics by writing them down. In a hundred-person company, the architect-CEO function — the role that owns the harness, the validation gates, and the quality dimensions the system enforces — also owns the metric definitions and the dashboards that surface them. The board's question about AI maturity is answered, ultimately, by the architect-CEO. The data is produced by the harness. The interpretation is produced by leadership.
Most organizations have not built this function deliberately. The metrics they show their boards today are the metrics their tooling vendors happened to instrument by default — usage hours, suggestions accepted, prompts run. Vendor metrics are about vendor product adoption. They are not metrics of engineering effectiveness for the buying organization. Confusing the two is how the AI investment ends up reported in terms that do not connect to the strategic outcomes it was supposed to produce.
The shift to effectiveness metrics requires the engineering organization to define what effectiveness means in its own terms, instrument the harness to measure it, and report on the metrics that result. It is unfashionable work. It is also the prerequisite for being able to answer the board, the audit committee, and the customer when they ask whether the AI investment is sustainable.
The diagnostic question
What metrics would survive if your board asked tomorrow how you evaluate AI engineering?
If the metrics you would present are commits, velocity, time saved, or any other activity-side measurement, the dashboard is theater. The board may accept it on first review, but it will not survive a second review where someone asks what these numbers predict about quality, sustainability, or risk. Activity metrics do not predict any of those things in an AI-driven pipeline.
If the metrics describe specification quality, output correctness, rework rate, harness reliability, and time to validated output, the dashboard is engineering. It describes a system that produces work the organization can trust. It will survive a second review, because the question of whether AI is working becomes the question of whether these numbers are improving over time, and the answer is observable.
The metrics do not have to be perfect. They have to describe effectiveness rather than activity. The five categories above are a starting point. Different teams will refine them, weight them, and add organization-specific dimensions. The principle is constant: measure the system that produces the output, not the volume of output produced.
Specify. Direct. Validate. Measure. The four steps describe the engineering loop the harness runs. The fourth is the one most organizations skip, because the legacy metrics felt like they covered it. They did not. The board will eventually notice. Better to lead the conversation than to be caught by it.
What would survive if your board asked tomorrow how you evaluate AI engineering?